

The first time I opened a price chart, I stared at it the way people stare at airport maps: hopeful, slightly confused, and pretending they understood more than they did. Lines zigzagged everywhere. Candles flashed red and green. Indicators hovered beneath the chart like secret code. Then I realized something important. Technical Analysis is not about predicting the future with magic. It is about reading behavior, spotting patterns, and making more thoughtful decisions in a fast-moving market. In the world of Economic Analysis, that matters a lot.
Prices often reflect emotion, expectations, and reactions long before headlines fully explain them. When used well, this method can help investors, analysts, and curious beginners identify trends, manage risk, and stay calmer when the market gets noisy. It can also sharpen your judgment when building an investment plan, especially when you need a practical way to study momentum, support, resistance, and volume without drowning in jargon.
Tools Needed
Before you begin, gather a few basics. You do not need a trading desk with six glowing monitors to make this work. A laptop, a stable internet connection, and access to a charting platform are enough for most people. Technical Analysis becomes easier when your tools are simple and familiar, so start with one platform, one asset class, and one time frame you can follow consistently. A notebook or spreadsheet also helps because good chart reading is part observation and part memory. When you write down why a setup looked strong or weak, you train your eye faster. Think of it like learning a sport. Watching helps, but repetition builds skill.
| Tool or Material | Why You Need It |
|---|---|
| Charting platform | To view candlestick charts, indicators, and drawing tools |
| Internet connection | To access live or delayed market data reliably |
| Notebook or spreadsheet | To record patterns, entries, exits, and lessons learned |
| Asset watchlist | To stay focused on a few markets instead of chasing everything |
| Basic indicator set | To track trend, momentum, and volume without clutter |
Technical Analysis Instructions
Step 1: Choose one market and one time frame
Start small. Pick a single market, such as a stock index, a currency pair, or a large-cap company, and stick with one main time frame. This first step matters because Technical Analysis gets messy when you jump from a five-minute chart to a monthly chart every few seconds. A beginner often learns faster by watching one daily chart for a few weeks than by skimming twenty charts in one afternoon. I made that mistake early on and ended each session with more screenshots than understanding. Focus creates clarity.
Step 2: Identify the trend before anything else
Once your chart is open, step back and ask the simplest question first: is price generally moving up, down, or sideways? That question is the heart of Technical Analysis because trends shape everything else. Draw a few clean lines around recent highs and lows. Look for higher highs and higher lows in an uptrend, or lower highs and lower lows in a downtrend. If price keeps bouncing inside a narrow range, you may be looking at indecision. This is also where traders start comparing ideas like trading strategies, but remember that strategy should follow the chart, not the other way around.
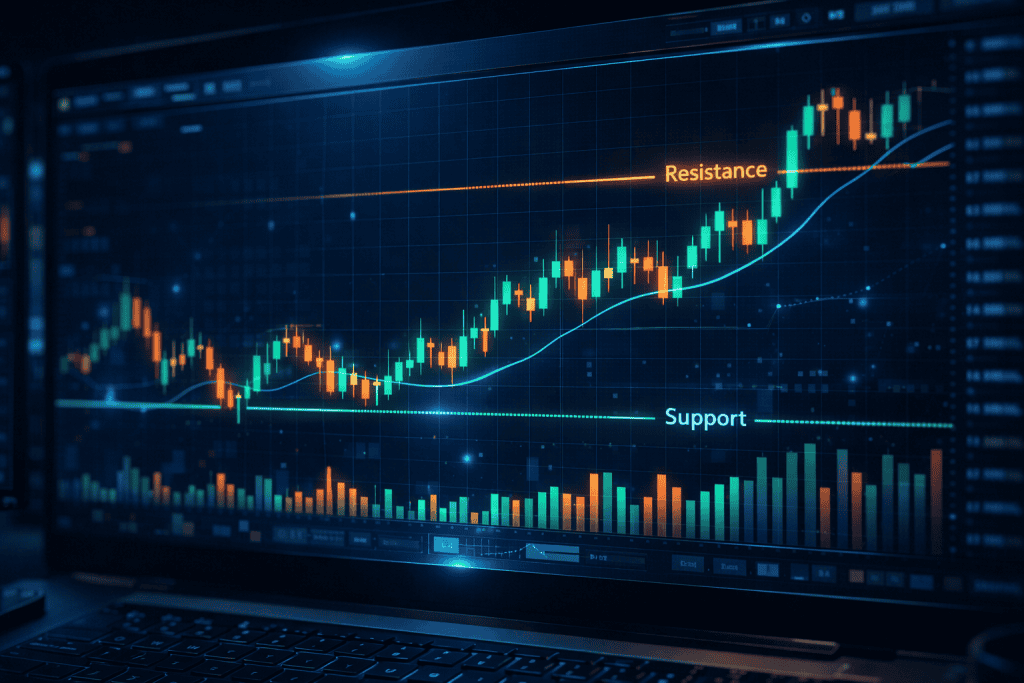
Step 3: Mark support, resistance, and volume clues
After spotting the trend, identify zones where price repeatedly stalls, reverses, or accelerates. These are your support and resistance areas, and they often reveal where buyers or sellers are most active. In Technical Analysis, these levels act like memory points for the market. Add volume if your platform offers it. A breakout with strong volume often carries more weight than a breakout that limps along quietly. You are not trying to decorate the chart. You are trying to understand where conviction lives. A clean chart with a few meaningful levels beats an overloaded chart every time.
Step 4: Use indicators carefully, then build a decision rule
Indicators can help, but they should support your reading, not replace it. In Technical Analysis, beginners often pile on RSI, MACD, moving averages, Bollinger Bands, and three other tools until the chart looks like a dashboard in a spaceship. Pick one or two. A moving average can help with direction, while RSI can hint at momentum. Then create a simple rule for yourself: trend first, key level second, indicator confirmation third. That rule gives structure and stops impulsive decisions, especially when you start hearing bold claims about the Best stocks to buy from every corner of the internet.
Step 5: Record the setup and review the outcome
This is the step people skip, and it is often the one that teaches the most. Save a screenshot, write down the setup, note where price was relative to trend and support or resistance, and record what happened next. Technical Analysis improves through review. Sometimes the chart will validate your idea beautifully. Other times it will humble you in under twenty minutes. Both outcomes are useful. The point is not to be right every time. The point is to become more disciplined, more observant, and less reactive. That is especially valuable during a market crash, when emotions get loud and structure becomes your anchor.
Technical Analysis Tips and Warnings

The best chart readers are usually not the flashiest people in the room. They are patient, methodical, and surprisingly boring in the best possible way. Technical Analysis rewards those habits. Try to keep your chart layout consistent so your brain is not relearning the screen every day. Review charts at the same time each session. Use alerts for key levels instead of staring at every candle like it is a thriller movie. And remember that the market is not a puzzle designed to make you feel smart. It is a living system shaped by money, fear, greed, policy shifts, and the broader Economic System. Respecting that complexity makes you better.
A few warnings matter just as much. Technical Analysis can be powerful, but it is not certainty. Patterns fail. Breakouts reverse. Indicators lag. News can hit unexpectedly and flip a chart in seconds. One common mistake is forcing a pattern because you want a trade to exist. Another is ignoring the larger time frame and reacting only to short-term noise. I once convinced myself I had found the perfect setup, only to realize I had drawn support on the wrong swing low. The chart was not wrong. I was rushing. Slow down, keep risk small, and let the evidence do the talking.
| Tip or Warning | Why It Matters |
|---|---|
| Keep charts clean | Too many indicators create confusion and conflicting signals |
| Use one routine | Consistency improves pattern recognition over time |
| Check the bigger trend | Small moves make more sense inside the larger market context |
| Define risk first | A good setup still needs a clear exit if it fails |
| Do not force patterns | Seeing what you want to see leads to poor decisions |
| Review old trades | Mistakes become useful when they are studied honestly |
Conclusion
Learning Technical Analysis is a lot like learning to read weather signs before a storm. At first, every cloud looks the same. Then, with practice, you notice shape, speed, direction, and pressure. The process is similar here. Start with one market and one time frame. Identify the trend. Mark support and resistance. Use a small number of indicators. Record what you see and review it later with honesty.
Over time, the chart becomes less noisy and more revealing. In Economic Analysis, that skill can help you interpret market behavior with more confidence and less guesswork. You do not need to become a full-time trader to benefit from it. You just need curiosity, patience, and a willingness to learn from both wins and mistakes. Open a chart, keep it simple, and begin where you are.
FAQ
How can Technical Analysis help beginners in Economic Analysis make better market decisions?
For beginners, the biggest benefit is structure. Instead of reacting to every headline or rumor, you learn to observe price behavior, trend direction, and important levels. That creates a clearer decision-making process inside Economic Analysis because you are grounding your view in what the market is actually doing. It also helps reduce emotional choices by giving you repeatable criteria for entries, exits, and risk.
What are the best beginner-friendly tools for Technical Analysis in Economic Analysis?
The most useful starting tools are candlestick charts, support and resistance lines, volume, and one simple indicator such as a moving average or RSI. In Economic Analysis, these tools are enough to help you read momentum and market structure without overwhelming yourself. A reliable charting platform and a trade journal are often more valuable than a long list of fancy indicators you barely understand.
Is Technical Analysis enough on its own for long-term market research in Economic Analysis?
It can be helpful on its own for timing, trend observation, and risk control, but it works best when paired with broader context. In Economic Analysis, price action shows how the market is reacting, while macro data, company fundamentals, and policy changes help explain why. Used together, they give a more balanced view than either approach alone.
Resources
- Corporate Finance Institute. Technical Analysis
- Investopedia. Technical Analysis Strategies for Beginners
- Finbold. Technical Analysis Guide
- OANDA. Introduction to Technical Analysis
- TradingView. Technical Analysis Education