
When it comes to understanding the Nikkei 225 Index, you’re not just looking at stock prices. You are gaining access to the pulse of the Japanese stock market. This index represents 225 of Japan’s most influential and actively traded companies, spanning industries such as technology, finance, automotive, and consumer goods. By studying the Nikkei 225 Index, investors can gain valuable insight into the economic direction of Japan, as well as global market reactions, since Japan plays a major role in the world economy.
For financial analysts and professionals, the Nikkei Index offers a powerful lens to measure performance trends and economic shifts. Retail traders can use it to develop informed trading strategies or diversify their portfolios. Meanwhile, long-term investors rely on the Nikkei to align their investment plan with economic forecasts. Tracking the Nikkei Index also provides a strong foundation for anyone involved in international finance, helping bridge Eastern and Western market trends. Whether you’re day trading or investing for the future, understanding the behavior and components of the Nikkei 225 Index empowers you to navigate market opportunities with clarity and confidence.
Nikkei 225 index Materials or Tools Needed
To successfully track and interpret the Nikkei 225 Index, a few tools and materials are essential. These help you analyze trends, access real-time data, and make strategic moves confidently.
| Materials/Tools | Purpose |
|---|---|
| Financial news websites | For real-time updates and index movement |
| Charting platform (e.g., TradingView) | Visualize historical and intraday performance |
| Economic calendars | Identify news events affecting Japanese markets |
| Broker platform | Place trades or monitor Nikkei futures |
| Notebook or tracking software | Record insights and patterns over time |
Nikkei 225 index Instructions
Step 1: Access Reliable Sources
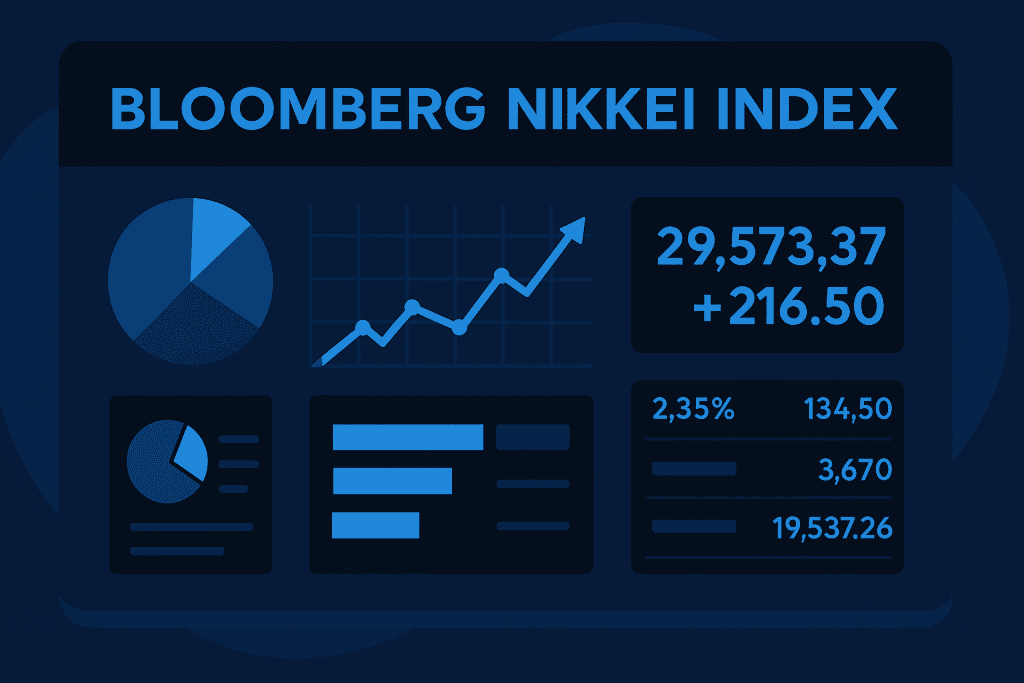
To begin tracking the Nikkei 225 Index effectively, start by identifying trustworthy sources that deliver consistent and real-time information. Websites such as Bloomberg and Investing.com are considered industry standards for market data. They offer up-to-the-minute performance stats, historical data trends, and news updates that influence index movements. These platforms also feature insights on individual companies listed in the Nikkei Index, allowing for deeper analysis. Bookmarking these sources helps you stay informed of sudden changes, such as major economic events or corporate earnings reports.
By consulting multiple sources, you ensure a balanced and accurate view of the Japanese stock market. This practice forms the foundation of reliable research and helps you anticipate potential market shifts, giving you a strategic advantage whether you’re trading or investing.
Step 2: Use a Charting Platform
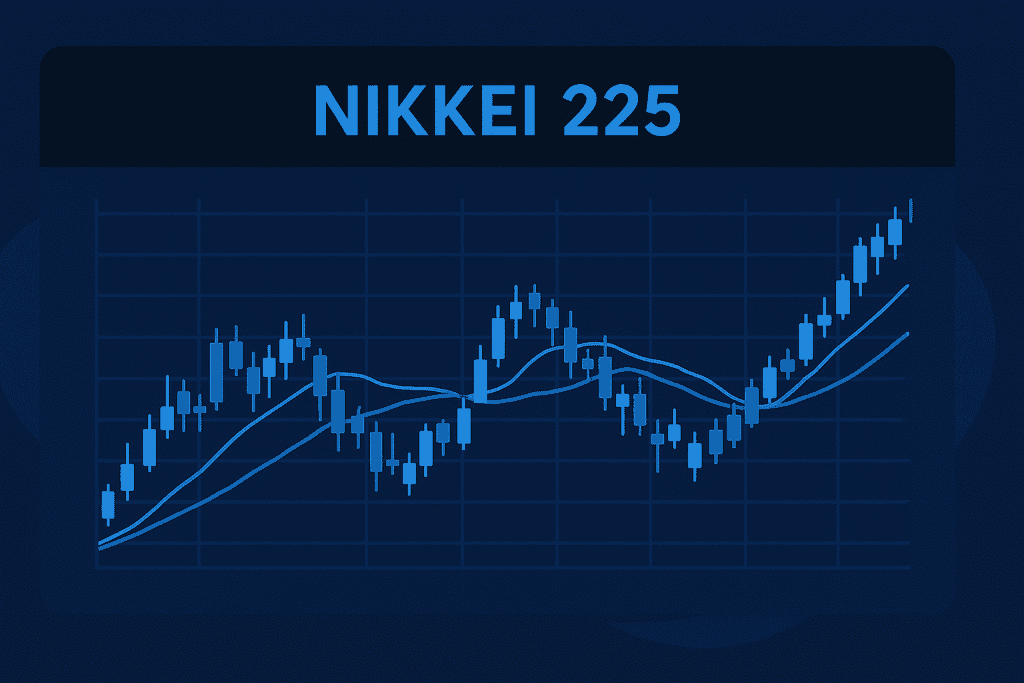
Once you have access to reliable data, the next step is using a charting platform to visualize market movements. Tools like TradingView or brokerage platforms offer customizable charts that track the Nikkei 225 Index in real time. These platforms provide technical indicators such as Moving Averages, MACD, RSI, and Bollinger Bands to help you interpret trends.
By learning how to read these signals, you can detect possible entry or exit points, understand momentum, and anticipate reversals. This approach is especially helpful for active traders who rely on technical patterns to make fast decisions. For beginners, starting with basic trendlines and price action will help build confidence.
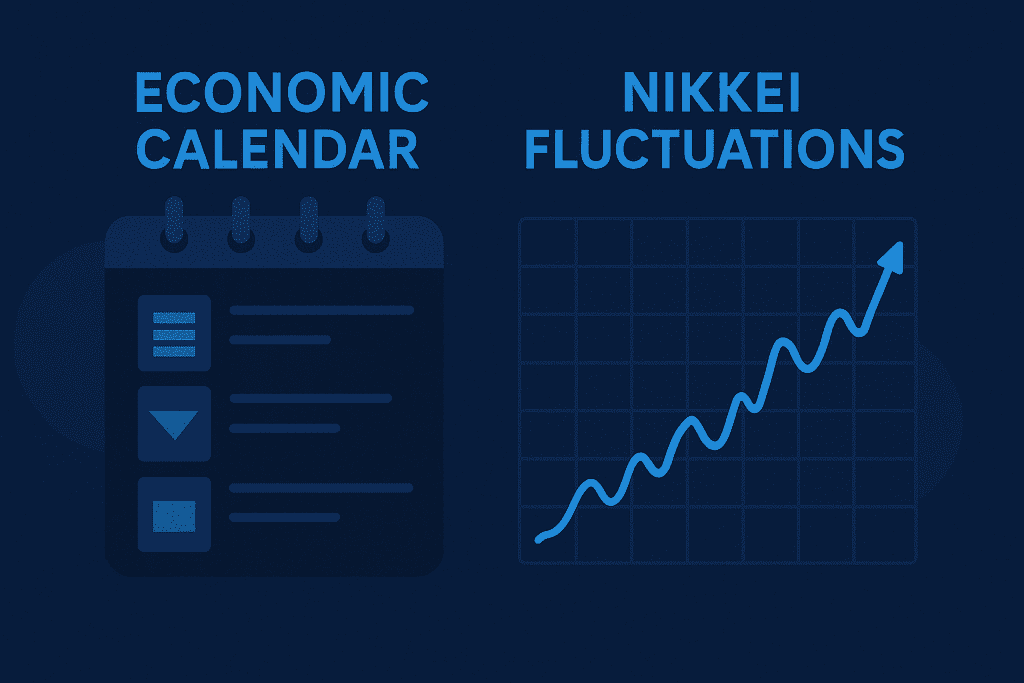
Step 3: Correlate With Economic Events
The Nikkei 225 Index does not move in isolation. It responds directly to economic developments in Japan and around the world. That’s why aligning your technical analysis with key economic events is essential. Use economic calendars provided by sites like Investing.com to keep track of scheduled announcements, such as central bank interest rate decisions, GDP releases, and inflation reports.
A single statement from the Bank of Japan or a change in US monetary policy can dramatically influence investor sentiment. By understanding the timing and impact of these events, you gain an extra layer of context to your analysis. This can prevent surprises during trading sessions and helps you anticipate volatility that may affect your position in the Nikkei Index.
Step 4: Compare With Other Indices
Comparing the Nikkei 225 Index with other major indices like the S&P 500, FTSE 100, or Hang Seng allows you to identify broader market trends and assess Japan’s economic performance in a global context. If the Nikkei moves upward while other global indices decline, it might suggest domestic strength or isolated market behavior. Conversely, if all indices are rising, it could point to a global economic upswing.
Cross-comparison reveals correlation, divergence, and international investor sentiment, offering a bigger picture of where capital is flowing. This step is vital for investors managing global portfolios who need to allocate assets based on performance and risk across regions. It also helps you avoid tunnel vision by ensuring your strategy reflects both local and international market dynamics.
Nikkei 225 index Tips and Warnings
Monitoring the Nikkei 225 Index is not without its challenges. Here’s how to make the most of your efforts while avoiding common errors.
| Tips | Warnings |
|---|---|
| Cross-reference with multiple sources | Don’t rely on outdated news or single-source data |
| Set alerts for major index movements | Avoid panic trades during high volatility |
| Practice using demo accounts for futures trading | Overtrading on leverage can lead to quick losses |
| Combine with trading strategies for clarity | Ignoring global market trends leads to partial analysis |
| Include the index in your broader investment plan | Focusing only on Nikkei may miss global opportunities |
Ensure you diversify your approach. While it’s tempting to chase every tick, true insights come from calm, consistent analysis. Use alerts, set your rules, and always look beyond the charts to understand what’s really moving the Nikkei 225 Index. This balance helps reduce risk and increase clarity, especially for those who trade Nikkei futures or plan long-term holdings.
Conclusion
The Nikkei 225 Index is more than just a benchmark for Japan’s economic activity. It serves as a practical guide for investors, traders, and analysts aiming to understand broader market behavior and sector-specific performance. By learning how to track its movement through charts, financial news, and economic indicators, you equip yourself with the tools to make more informed and strategic decisions.
The process does not require complex tools or advanced training. With consistency and attention to key events and patterns, even beginners can develop a strong grasp of the index. Start with the basics, monitor regularly, and let experience guide your next move. Over time, you’ll gain the insight needed to respond confidently to shifts in the market.
FAQ
What does the Nikkei 225 Index reveal about Japan’s economy?
The Nikkei 225 Index is a snapshot of Japan’s top companies. It reflects sector strength, investor sentiment, and the broader health of the Japanese stock market. Economic professionals rely on it for performance benchmarks and trend forecasting.
Can I include the Nikkei 225 Index in my global investment plan?
Absolutely. The Nikkei is ideal for diversifying your investment plan. It adds exposure to Asia’s second-largest economy and balances portfolios that may be overly reliant on Western markets.
How do Nikkei futures differ from the Nikkei Index itself?
While the Nikkei Index represents current market prices, Nikkei futures are derivative contracts based on expected future prices. They allow for speculation and hedging, especially during volatile conditions or after trading hours.
Resources
- Nikkei Inc. Nikkei 225 Index Component Stocks
- Investing.com Japan Nikkei 225 Index
- Bloomberg Nikkei 225 Index Overview
- GuruFocus Nikkei 225 Surges Past 38000 Mark Led by Electronics and Banking Stocks
- Investing News Japan Stocks Lower at Close of Trade, Nikkei 225 Down 0.88%