Unveiling the Yield Curve

Interpreting an inverted yield curve is crucial for professionals and enthusiasts in economic analysis. This phenomenon often signals shifts in the financial landscape, potentially forewarning a recession. By understanding the yield curve, particularly the 2-10 inversion, investors can make informed decisions about risk management and portfolio adjustments. In this guide, we’ll break down what an inverted yield curve is, how to interpret it, and why it’s a significant indicator for economic trends.
Tools to Analyze Yield Curve
To effectively interpret the inverted yield curve, you’ll need a few tools and resources:
| Material/Tool | Purpose |
|---|---|
| Financial News Platforms | Stay updated on changes in the yield curve. |
| Yield Curve Charts | Visualize the inversion, particularly the 2-10 spread. |
| Economic Reports | Analyze market trends and recession signals. |
| Analytical Tools (e.g., YCharts, Bloomberg) | Track yield curve shifts in real time. |
| Investment Portfolios | Adjust holdings based on yield curve insights. |
Access reliable resources like Investopedia and Corporate Finance Institute for detailed explanations of this.
Steps to Analyze Inverted Yield Curve
Step 1: Understand What a Yield Curve Is
A yield curve plots interest rates of bonds with varying maturities, typically focusing on 2-year and 10-year Treasury yields. Under normal conditions, longer-term bonds offer higher returns due to added risk and time. A steep yield curve indicates optimism about future economic growth. Use Corporate Finance Institute to review examples of yield curves and their importance in market analysis.
Step 2: Identify an Inversion

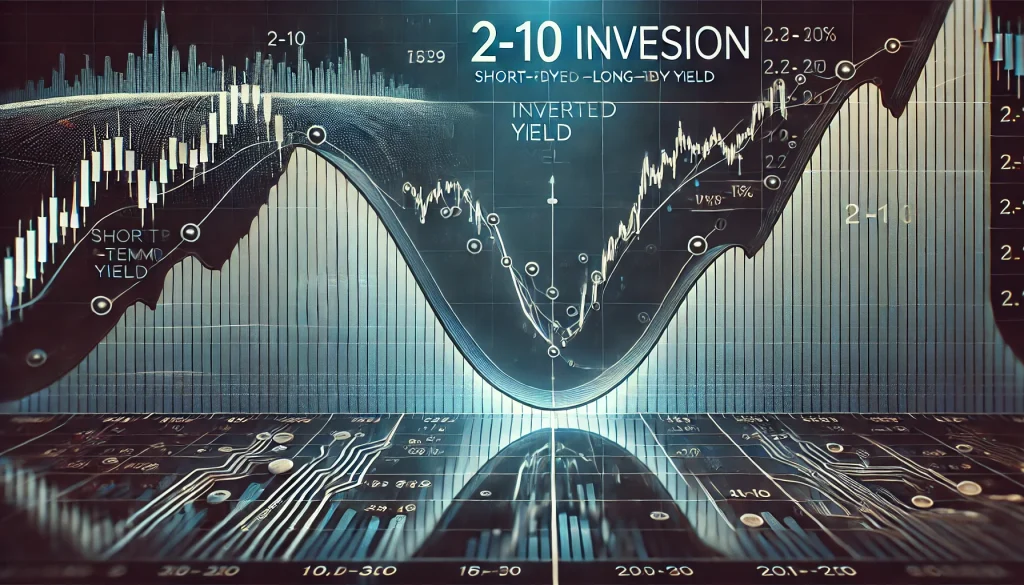
An inverted yield curve occurs when short-term yields, like the 2-year, exceed long-term yields, such as the 10-year. This indicates that investors expect slower economic growth or a recession. Platforms like YCharts or Investopedia provide real-time yield spread analysis to track inversion signs effectively.
Step 3: Analyze Historical Patterns
Study past yield curve data to understand its reliability as an economic indicator. Historically, inversions precede recessions, but the timeline between inversion and recession can vary. According to Investopedia, every U.S. recession in the last 50 years was preceded by this. However, not all inversions lead to recessions, highlighting the importance of context.
Step 4: Evaluate Economic Signals
Combine yield curve analysis with other indicators like inflation, unemployment rates, and consumer confidence. A 2-10 inversion might suggest economic slowdown, but corroborating data is necessary for a comprehensive assessment. Corporate Finance Institute notes that the yield curve should be part of a broader toolkit for analyzing economic health.
Step 5: Adjust Financial Strategies
Align your financial strategies with yield curve insights. Consider these actions:
- Diversify your investments: Include defensive stocks, commodities, or gold.
- Prioritize liquidity: Maintain accessible savings for emergencies.
- Monitor market conditions: Stay informed about economic developments that influence the curve.
The Get YCharts Blog offers actionable tips on navigating market changes during yield curve shifts.
Tips and Warnings

Tips for Success
- Use the yield curve alongside other indicators for accurate insights.
- Regularly update your analysis with real-time data.
- Familiarize yourself with key spreads like 2-10 for deeper understanding.
Warnings
- Avoid panic selling based on an inverted yield curve alone.
- Don’t rely solely on the 2-10 spread; consider the entire curve.
- Remember, inversions signal risk but aren’t guarantees of recessions.
Conclusion
Interpreting this is a vital skill for navigating financial markets. By understanding its structure, recognizing inversions, and aligning strategies accordingly, you can stay ahead of potential economic shifts. Utilize resources like Investopedia and YCharts to refine your analysis. While yield curves provide valuable insights, consider them as part of a broader economic strategy to mitigate risk and capitalize on opportunities.
FAQ
What is an inverted yield curve?
This occurs when short-term bond yields, like the 2-year Treasury, exceed long-term yields, such as the 10-year Treasury. It often signals an economic slowdown or recession.
Why is the 2-10 spread important?
The 2-10 spread compares yields of 2-year and 10-year bonds. An inversion in this spread is a reliable indicator of market sentiment, often forewarning economic downturns.
How can I navigate an inverted yield curve?
To navigate this, focus on diversification, include defensive assets, and avoid speculative risks. Use tools like YCharts to monitor changes in the curve.
References
- Investopedia. What Is an Inverted Yield Curve?
- Corporate Finance Institute. Understanding the Yield Curve
- Corporate Finance Institute. Inverted Yield Curve Overview
- Get YCharts Blog. What an Inverted Yield Curve Means
- YouTube. Understanding Yield Curve Inversions
