
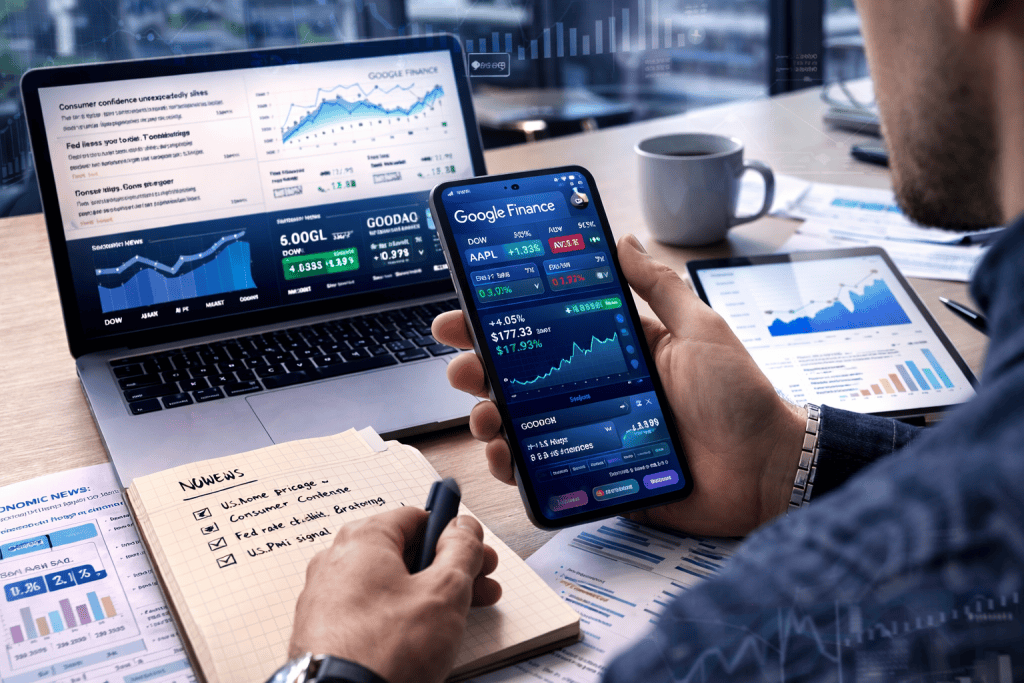
The first time I tried to make sense of the market, I had a dozen tabs open, three half-finished notes, and one growing suspicion that I was making things far more complicated than they needed to be. Then I gave the Google Finance App a real chance. What surprised me most was not just the numbers, but how quickly those numbers started telling a story. For anyone working in Economic Analysis, that matters. You are not simply watching prices move; you are learning how industries breathe, how investor mood shifts, and how global events ripple through markets.
The Google Finance App helps turn scattered information into something more readable, practical, and far less intimidating. Google’s own help documentation explains that users can create portfolios, compare performance against stocks and indexes, view returns, and follow news tied to their holdings. Meanwhile, supporting guides show it can also be paired with Google Sheets for deeper analysis using real-time and historical data.
Tools Needed
To get started, you do not need a fancy terminal, a finance degree, or a wall full of screens like in the movies. You need a Google account, a device with internet access, and a clear goal. Maybe you want to track sectors, build a watchlist, study the effect of a market crash, or slowly shape an investment plan that feels realistic instead of dramatic. If you also want deeper spreadsheet-based review, Google Sheets is useful because the GOOGLEFINANCE function can pull current prices, historical prices, and index data into a sheet. That makes the platform especially handy for Economic Analysis work that blends quick observation with structured comparison.
| Tool or Material | Why You Need It |
|---|---|
| Google account | Required to create and manage portfolios |
| Browser or mobile device | Lets you access market pages, charts, and watchlists |
| Stable internet connection | Needed for live quotes, news, and syncing |
| Google Sheets | Helpful for historical tracking and custom analysis |
| List of companies, funds, or indices | Gives you a practical starting point |
Google Finance App Instructions
Step 1: Open the platform and define your purpose
Start by visiting Google Finance and resisting the urge to click everything at once. Take one breath and decide what you want from the session. Are you tracking a company, a sector, a crypto asset, or a benchmark index? The platform becomes much more useful when you begin with a simple question, such as whether a stock is outperforming its sector or how recent headlines may affect sentiment. This is where Economic Analysis starts to feel less abstract and more like detective work. Google notes that you can compare your portfolio with other assets and view performance over time, which makes goal-setting even more useful.
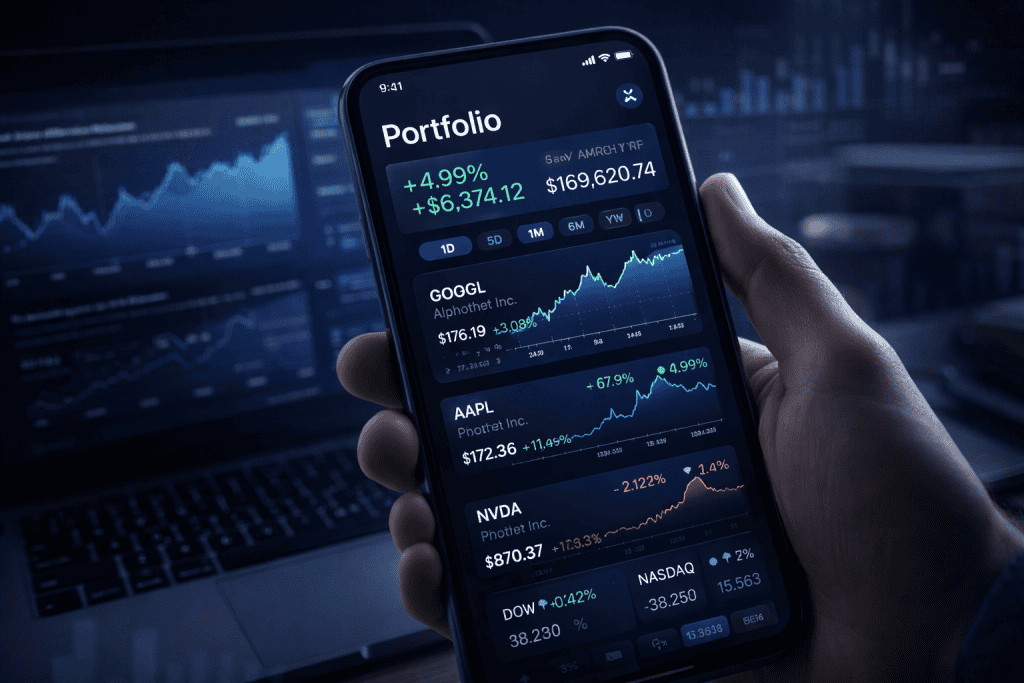
Step 2: Create a portfolio or watchlist
The Google Finance App becomes far more helpful once you organize what you care about. Google’s help page says you can create a new portfolio, add investments, rename or delete it later, and even turn a watchlist into a portfolio. That flexibility is great for beginners and professionals alike. I usually recommend starting with a small group of assets instead of stuffing in every ticker you have ever heard mentioned in a video. Add a few companies, maybe one broad index, and one sector you want to understand better. Clean lists lead to clearer thinking, and clearer thinking usually beats noisy trading strategies every time.
Step 3: Add holdings and compare performance
Once your list is built, add holdings carefully. Google explains that you can enter the number of shares, purchase date, and purchase price, and even add multiple purchases made on different dates. This matters because your returns become more meaningful when your cost basis is accurate. The platform also lets you compare performance to suggested benchmarks or other assets using time-weighted rate of return, which is useful when you want a truer picture of performance. If you are studying the wider Economic System, this is where patterns begin to emerge: a company is never moving in isolation for long.
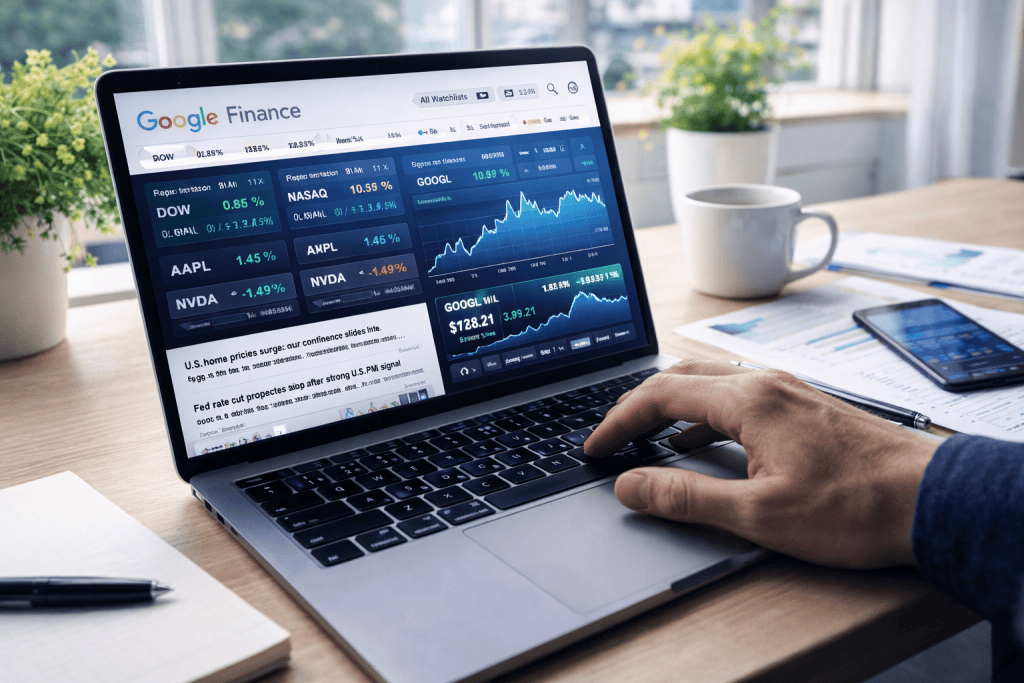
Step 4: Use charts, news, and historical context
A price on its own is just a number. A chart with context is a narrative. The Google Finance App lets you review balance changes across time periods such as 1M, 6M, and YTD, while related guides highlight how users can explore news, interactive tools, and broader market data for sectors and exchanges. For day-to-day reading, that means you can connect price movement with headlines instead of guessing. This is especially helpful when you are sorting hype from substance and trying to identify the Best stocks to buy based on context, not just excitement.
Step 5: Extend your analysis in Google Sheets
Here is where the Google Finance App starts feeling like a smart assistant rather than a simple dashboard. If you want to go beyond surface-level review, open Google Sheets and use the GOOGLEFINANCE function. According to Superjoin’s guide, you can pull current prices with formulas like price attributes, retrieve historical values with date ranges, and even track major indices such as the S&P 500. That gives you a tidy bridge between quick monitoring and structured Economic Analysis. I like this step because it turns “I think this trend is important” into “Here is the pattern, over the last 30 days, with evidence.”
Google Finance App Tips and Warnings
The best way to use the Google Finance App is to treat it like a sharp notebook, not a crystal ball. Keep your portfolio focused. Track assets you genuinely want to understand. Read the related news, but do not let every dramatic headline yank you in a different direction. A common beginner mistake is confusing visibility with insight. Just because a stock appears everywhere does not mean it deserves a place in your analysis. Another mistake is entering incomplete holding details, which can distort returns and make your portfolio feel more successful or more disastrous than it really is.
Google also notes that portfolio returns depend on the information you provide, including purchase price, so accuracy matters. The same caution applies in Sheets: formula-driven data is powerful, but the Superjoin guide recommends cross-checking for accuracy before using it for important decisions. That is wise advice. Good analysis is not built on speed alone; it is built on patience, comparison, and a little skepticism.
| Tip or Warning | Why It Matters |
|---|---|
| Start with a small portfolio | Easier to spot trends without clutter |
| Enter purchase data accurately | Returns depend on correct cost basis |
| Compare assets to benchmarks | Prevents one-sided conclusions |
| Use news for context, not panic | Headlines can distort judgment |
| Cross-check spreadsheet output | Formula data should support, not replace, judgment |
Conclusion
Used well, the Google Finance App can make Economic Analysis feel far more approachable. You begin by setting a clear goal, then build a portfolio, enter accurate holdings, compare performance, study the chart patterns, and add context through news and benchmarks. If you want more depth, pairing it with Google Sheets helps you turn observations into a repeatable process with historical data and cleaner comparisons.
That combination is what makes the Google Finance App especially useful: it meets you where you are, whether you are just learning the market or refining a more disciplined routine. Give it a try with a handful of assets you actually care about. Spend a week observing instead of rushing. You may be surprised by how much confidence grows when the data stops feeling like noise and starts feeling like a story you can read.
FAQ
How can the Google Finance App help with Economic Analysis for beginners?
The Google Finance App helps beginners by putting prices, performance charts, portfolio tracking, and relevant news in one place. For Economic Analysis, that means you can look at a company or index and quickly connect market movement with broader events, sector shifts, and investor sentiment. It is especially useful for learning how to compare assets over time without needing an advanced trading terminal on day one. Google’s documentation also shows that portfolio comparison tools and return views are built in, which makes early learning much less overwhelming.
Can the Google Finance App be used with Google Sheets for deeper Economic Analysis?
Yes. The Google Finance App works especially well alongside Google Sheets because the GOOGLEFINANCE function can retrieve current prices, selected attributes, and historical data ranges. That allows you to build timelines, compare assets, and organize evidence for longer-term Economic Analysis. It is a practical setup for anyone who wants more structure than a watchlist but less complexity than a professional data terminal. Superjoin’s guide outlines the function syntax and examples for live prices, historical data, and index tracking.
What is the best way to use the Google Finance App during volatile market conditions in Economic Analysis?
During volatile periods, the Google Finance App is most useful when you slow down and focus on context. Watch the chart across multiple time ranges, compare the asset to an index or peer, and read the related news before forming a conclusion. Volatility can make every move look urgent, but good Economic Analysis asks whether the move is temporary, structural, or part of a wider trend. Keeping a focused portfolio and checking historical patterns in Sheets can help reduce emotional decision-making.