
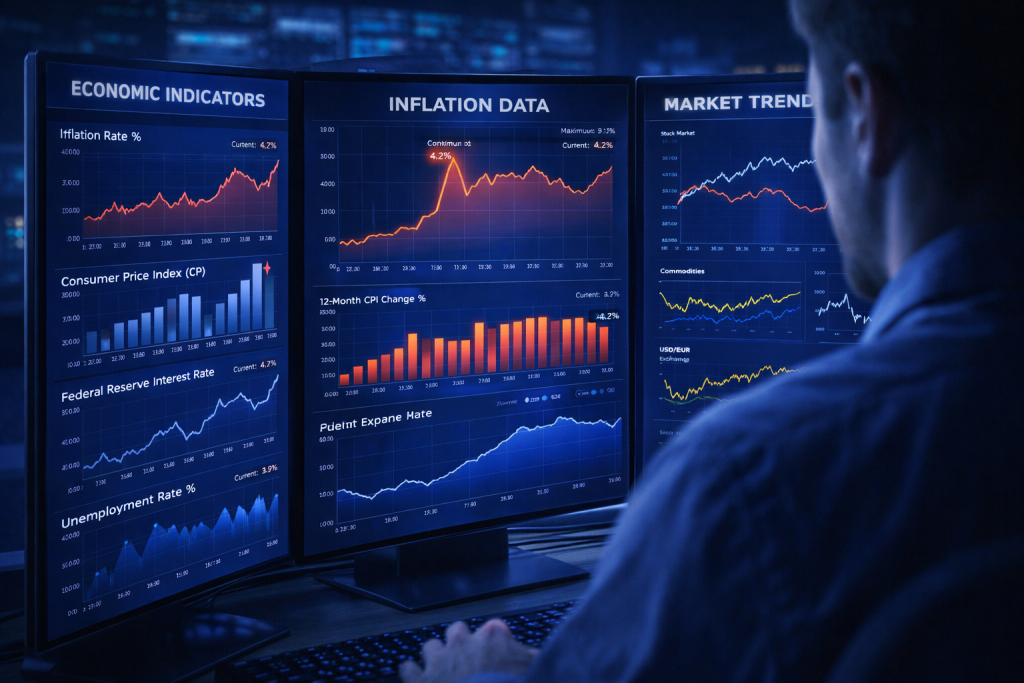
When I first started following financial news, I made the same mistake many beginners make: I treated every headline like a flashing emergency siren. One strong jobs report felt like a reason to celebrate. One weak inflation print felt like the sky was falling. Over time, I learned that the real skill is not reacting to noise. It is learning how to evaluate Economic Indicators with patience, context, and a little skepticism. In the world of Economic Analysis, that skill matters a lot.
Investors, business owners, analysts, journalists, and even curious readers use data to understand what is happening beneath the surface of daily news. A single number rarely tells the whole story, but a group of signals can reveal whether an economy is heating up, slowing down, or shifting direction. The benefit is simple: better judgment. Instead of guessing, you begin to read the economy the way a seasoned traveler reads weather signs before a long road trip.
Tools Needed
To evaluate Economic Indicators well, you do not need a trading floor, three monitors, or a graduate degree in macroeconomics. You need a dependable set of tools and the discipline to use them consistently. A notebook or digital document helps you record trends over time. A spreadsheet is useful for comparing releases month to month. Reliable financial news sources and official data websites matter because secondhand summaries can miss nuance. It also helps to have a basic calendar for release dates, since timing shapes market reactions. Most important, you need a framework. Without one, even good data can feel like a pile of puzzle pieces with no picture on the box.
| Tool or Material | Why It Helps |
|---|---|
| Notebook or notes app | Helps track patterns, surprises, and personal observations |
| Spreadsheet | Makes comparisons between current and past data easier |
| Economic calendar | Shows when major reports are released |
| Official data sources | Improves accuracy and reduces misinterpretation |
| Financial news coverage | Adds context, market reaction, and expert commentary |
| Basic framework | Keeps your analysis consistent from one report to the next |
Economic Indicators Instructions
Step 1: Start with the big picture
Before diving into numbers, ask a simple question: what story is the economy telling right now? Is growth picking up, cooling off, or moving sideways? This first step matters because Economic Indicators are easier to interpret when you already know the broader setting. Think of it like walking into a movie halfway through. If you do not know the plot, every scene feels confusing. Read a recent summary of growth, inflation, employment, and interest rates so you understand the backdrop before judging any new release.
Step 2: Separate leading, lagging, and coincident data
Not all indicators do the same job. Some hint at where the economy may go next, while others confirm what has already happened. Leading data can include manufacturing orders or consumer expectations. Lagging data often shows up in trends that are already established, like unemployment after a slowdown has begun. Coincident data moves with current conditions. This distinction keeps you from overreacting. A lot of people see one weak data point and assume recession is around the corner, but categories matter. Good Economic Analysis starts by understanding what each report is designed to signal.
Step 3: Compare the number with expectations
A raw number means little without context. When analysts evaluate Economic Indicators, they compare the actual result with forecasts, prior readings, and revisions. A jobs report that looks strong at first glance may be less impressive if economists expected much more. An inflation number that seems tame may still unsettle markets if the previous month was revised upward. This is where discipline beats drama. Do not stop at the headline. Ask what was expected, what changed, and whether the trend is becoming stronger or weaker over several months.
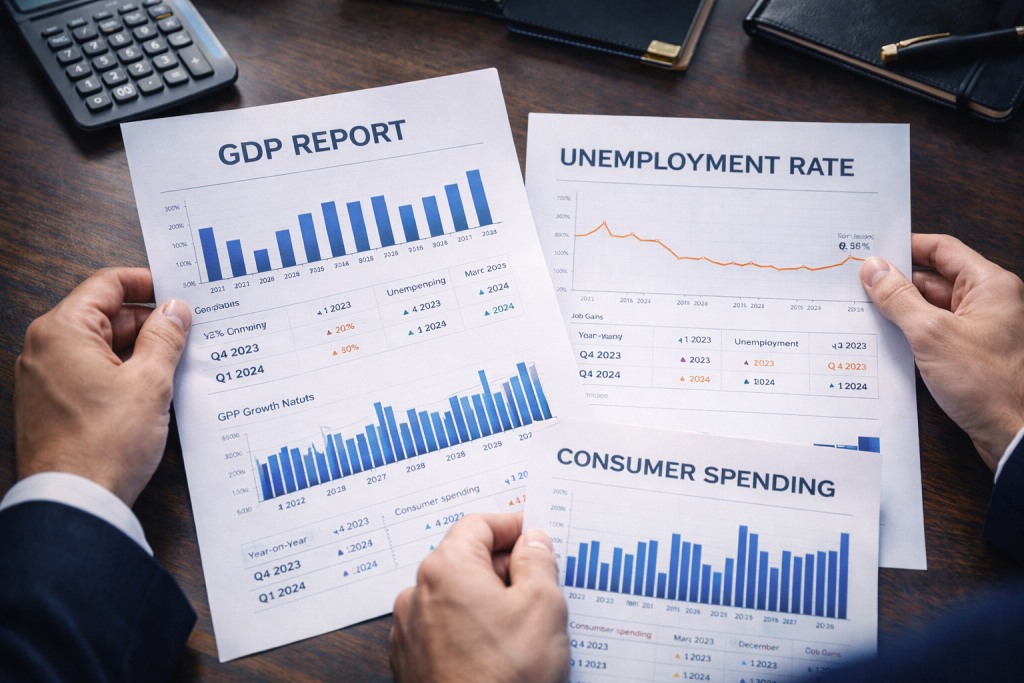
Step 4: Look for confirmation across related reports
One of the best habits in Economic Analysis is searching for agreement between different data sets. If retail sales are rising, are consumer confidence and wage growth supporting that story? If inflation is cooling, are producer prices and housing data moving in the same direction? This is how Economic Indicators become more useful. A lone figure can mislead, but several connected reports often point in the same direction. I like to think of it as listening to a choir rather than a soloist. One voice can crack. A full group is harder to ignore.
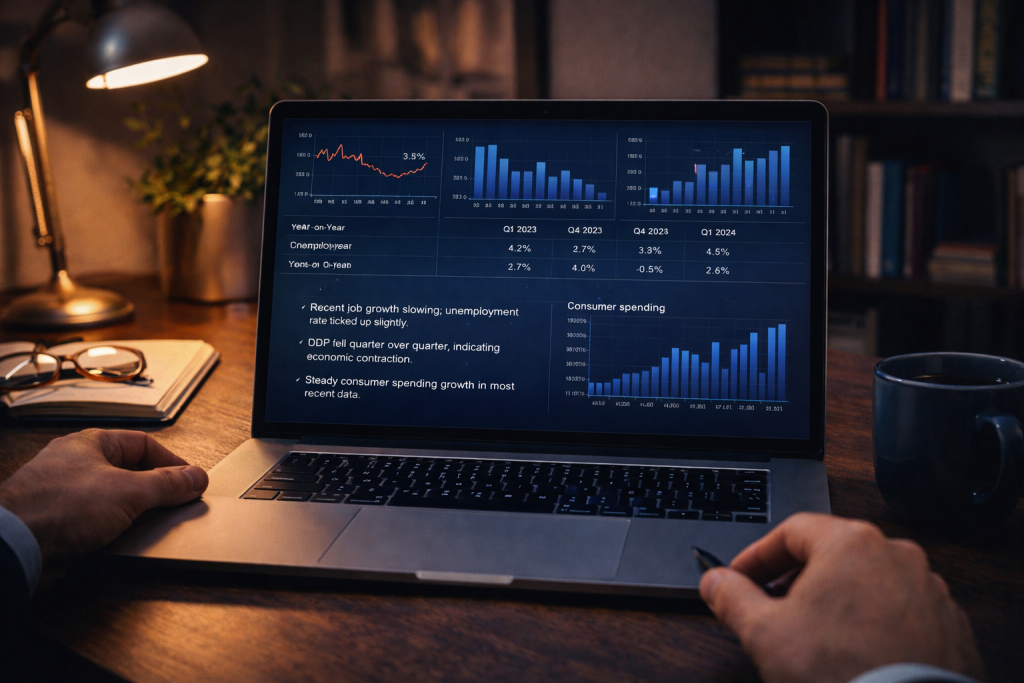
Step 5: Turn data into a practical conclusion
The final step is where analysis becomes useful. After reviewing Economic Indicators, decide what the data suggests for businesses, households, or investors. Does the economy look resilient, fragile, or mixed? Are borrowing conditions likely to tighten? Could consumer demand hold up for a few more quarters? This does not mean jumping to a dramatic forecast or building a generic investment plan from one report. It means forming a measured conclusion that can be updated as fresh numbers arrive. Good analysts stay flexible. They do not marry a narrative. They test it.
Economic Indicators Tips and Warnings
The hardest part of reading Economic Indicators is resisting the temptation to force every report into a neat little story. Real economies are messy. Some sectors sprint while others limp. Consumers may keep spending even when factories slow down. Inflation can cool in one category and flare up in another. That is why patience is such an underrated skill in Economic Analysis.
The best readers of data do not chase excitement. They look for consistency, watch revisions, and remember that markets often react to surprises rather than absolute levels. One month rarely defines a cycle. I learned that lesson after staring at a weak report years ago and assuming a market crash was just around the corner. It was not. The next two releases changed the picture completely.
Another useful tip is to match the indicator to the question you are trying to answer. If you are curious about consumer health, wages, retail sales, and confidence may tell you more than factory data. If you are studying inflation pressure, price indexes and wage growth are more relevant. People often read data for the thrill of prediction, hoping to uncover the Best stocks to buy or spot perfect trading strategies before everyone else. That is usually where mistakes begin. Data is most powerful when it improves judgment, not when it feeds overconfidence. It helps you understand the rhythm of the Economic System, not control it.
| Tip or Warning | Why It Matters |
|---|---|
| Do not rely on one report | Single releases can be noisy or revised later |
| Always compare trends | Multi-month patterns are more reliable than one-off moves |
| Watch revisions carefully | Yesterday’s story can change when old data is updated |
| Match data to your question | Different indicators answer different economic concerns |
| Avoid dramatic conclusions | Strong analysis is calm, measured, and adaptable |
| Use multiple sources | Context improves accuracy and reduces bias |
Conclusion
Evaluating Economic Indicators is not about memorizing jargon or pretending to predict the future with perfect precision. It is about building a repeatable habit of observation. Start with the big picture, sort the data by type, compare results with expectations, look for confirmation, and then draw a practical conclusion you are willing to revise later. That process turns scattered numbers into meaningful insight. In Economic Analysis, that kind of steady thinking is far more valuable than flashy certainty.
The more often you do it, the easier it becomes to spot patterns, ignore noise, and make sense of the headlines without getting pulled around by every twist. Try it the next time a major report is released. Open the data, slow down, and read beyond the first number. You may be surprised by how much clearer the economy begins to look.
FAQ
Why do economists study the data of economic indicators?
Economists study economic indicators to assess the health of the economy, predict future trends, and inform policy decisions.
How do leading economic indicators influence investment decisions?
Leading indicators, such as stock market performance or manufacturing activity, help investors anticipate market trends and adjust their portfolios accordingly.
What is the role of the Bureau of Labor Statistics in economic analysis?
The Bureau of Labor Statistics provides essential data, including unemployment rates, inflation, and labor productivity, which are crucial for evaluating economic performance.
Resources
- Corporate Finance Institute. Economic Indicator.
- Investopedia. Economic Indicator.
- Quickonomics. Economic Indicator.
- SmartAsset. Indicator Definition.
- Wall Street Mojo. Economic Indicator.