
In the ever-evolving world of technology trends, the Flowchart remains a timeless tool for clarity and innovation. Whether you’re designing a new app, streamlining business processes, or mapping algorithms, it helps translate complex logic into simple, visual steps. It bridges the gap between abstract ideas and actionable plans—something every innovator, coder, or entrepreneur can appreciate.
As technology advances rapidly, tools that foster understanding are more crucial than ever. Its not only enhance communication among technical and non-technical teams but also inspire better decision-making in a world driven by advanced technology and constant innovation.
What is Flowchart?
A Flowchart is a diagram that represents a process, workflow, or algorithm through various shapes and arrows. It shows the sequence of steps from start to finish, helping individuals visualize logic and identify potential bottlenecks.
In simple terms, it’s like a roadmap for problem-solving. It can also be referred to as process maps, flow diagrams, or logic charts. They serve as universal languages in tech and business, cutting through jargon to present processes visually.
Breaking Down Flowchart
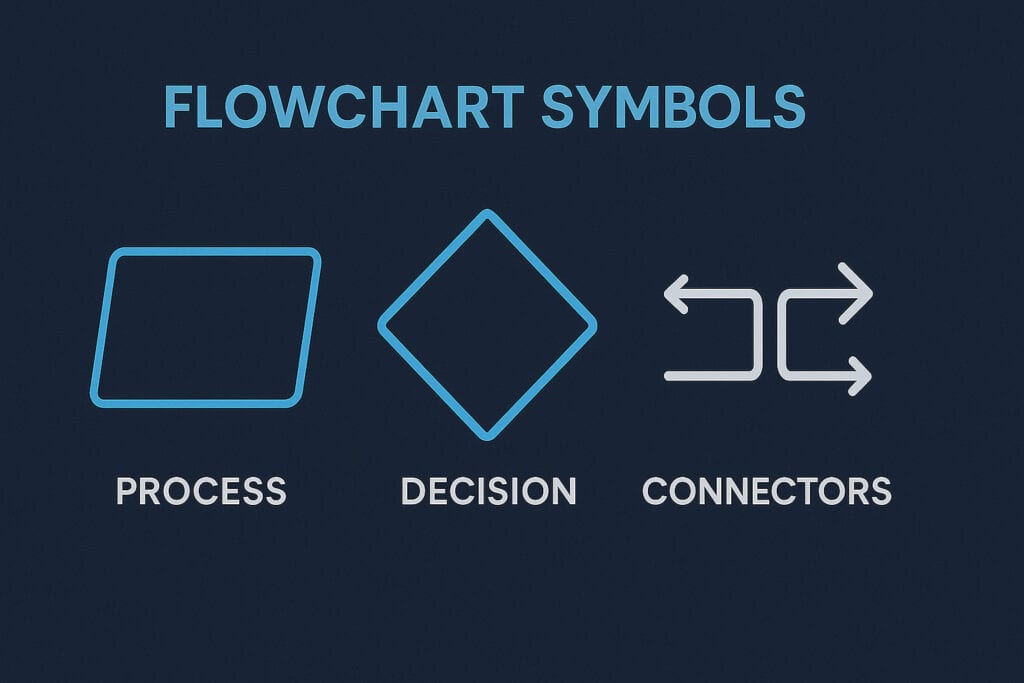
It comprises several core elements that work together to represent a process:
- Start/End Symbols – Usually ovals, these indicate where the process begins and ends.
- Process Steps – Rectangles that describe specific actions or tasks.
- Decisions – Diamonds that represent yes/no or true/false conditions.
- Connectors and Arrows – Lines that link steps and show direction or flow.
- Input/Output Symbols – Parallelograms showing data entry or result output.
For example, in software development, the chart might show how a login system processes user credentials—from input validation to access approval. Each step builds clarity, ensuring developers, testers, and clients share the same mental model.
History of Flowchart
The story of the Flowchart began in the early 20th century when engineers and mathematicians sought better ways to document processes. Frank Gilbreth, an industrial engineer, first introduced process charts in 1921 at the American Society of Mechanical Engineers (ASME). Over time, these evolved into the charts we recognize today—adopted by programmers, project managers, and analysts across industries.
| Year | Milestone | Key Contribution |
|---|---|---|
| 1921 | Process Chart introduced | Frank and Lillian Gilbreth introduced industrial process mapping. |
| 1940s | Flow Process Chart used in manufacturing | Helped visualize production systems. |
| 1950s | Flowchart adopted by IBM | Used for documenting computer algorithms. |
| 1980s | Digital Flowchart software emerged | Tools like Microsoft Visio gained popularity. |
| 2000s–Present | Cloud-based visualization tools | Enhanced collaboration and automation. |
Its evolution mirrors the growth of futuristic technology—adapting from paper sketches to dynamic digital interfaces integrated with IoT devices and AI tools.
Types of Flowchart
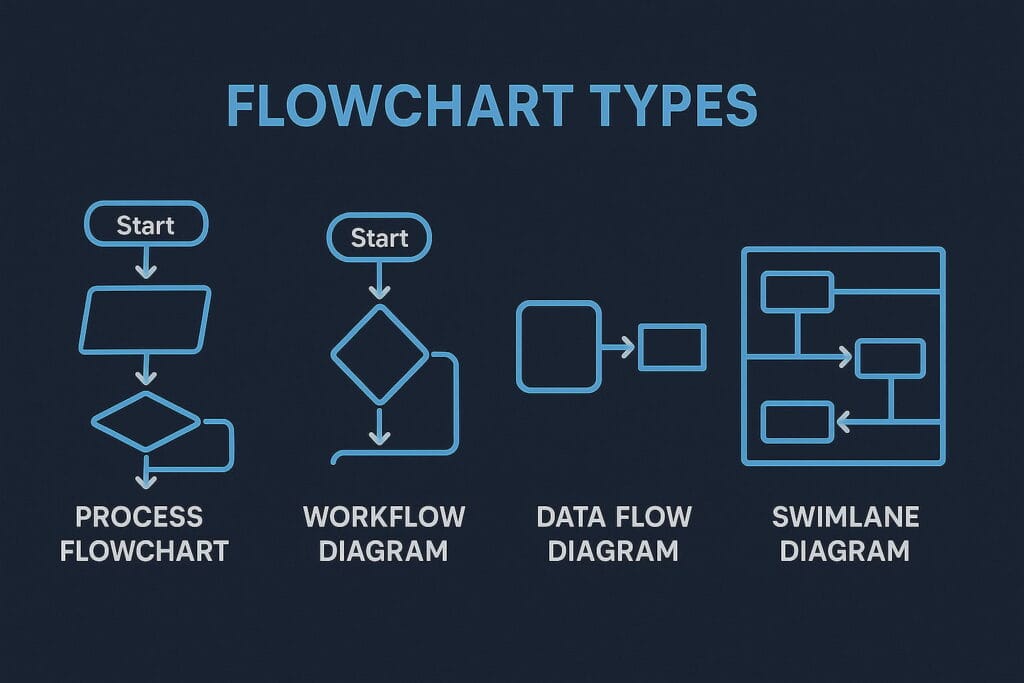
It comes in several forms, each designed to serve a specific purpose within technology and business operations.
Process Flowchart
This is the most common type, showing how tasks or activities are performed step-by-step. For instance, a software deployment process can be illustrated through development, testing, and release phases.
Data Flowchart
Used primarily in system design, it shows how data moves between components. It’s popular among developers who want to map how information travels within an application.
Decision Flowchart
This type focuses on conditional pathways, helping teams navigate multiple possible outcomes. It’s useful in troubleshooting, algorithm design, or AI decision-making systems.
Workflow Flowchart
Commonly used in project management, it outlines team responsibilities and deadlines. By visualizing workflow dependencies, businesses can streamline operations effectively.
System Flowchart
System Flowcharts map the relationships between inputs, processes, and outputs in technical systems. Engineers use these to document hardware-software interactions or automation frameworks.
How Does Flowchart Work?
It operates by converting abstract processes into visual steps. Here’s how it works:
- Identify the Process: Define the workflow or system you want to represent.
- List the Steps: Break down each stage of the process logically.
- Choose the Symbols: Use standard Flowchart symbols for clarity.
- Connect the Steps: Link them with arrows to show direction and flow.
- Review and Optimize: Analyze the chart to find redundancies or inefficiencies.
For instance, imagine building an automated customer support chatbot. The chart starts with the user’s query, then branches into decisions based on keywords or emotions, leading to either a response or escalation. This step-by-step visualization ensures smooth development and fewer errors.
Pros & Cons
It offers several key advantages, especially in simplifying complex ideas. They make it easier to visualize processes, communicate clearly, and identify inefficiencies. Teams can use this method to stay aligned, reduce misunderstandings, and make smarter decisions faster. They’re also useful for training and onboarding, providing a visual reference that helps new members grasp workflows quickly.
However, it has limitations. When dealing with large or dynamic systems, they can become cluttered and hard to maintain. They also require regular updates as processes change and may oversimplify situations that involve constant decision-making or unpredictable outcomes.
Despite these drawbacks, the benefits often outweigh the challenges. With modern digital tools, it can be easily edited, shared, and improved, making them invaluable in any environment that values clarity, collaboration, and innovation.
| Pros | Cons |
|---|---|
| Simplifies complex processes | Can become cluttered for large systems |
| Enhances team communication | Requires updates as processes change |
| Aids in troubleshooting | May oversimplify technical details |
| Improves workflow efficiency | Time-consuming to create initially |
| Ideal for visual learners | Not suitable for highly dynamic systems |
It remains popular because their benefits often outweigh the challenges, especially when used with digital tools that make updates seamless.
Uses of Flowchart
The charts have widespread applications across industries and technology sectors. They help visualize logic, streamline decisions, and improve communication between teams.
In Software Development
Developers rely on this chart to map algorithms, debug logic, and communicate system design to non-programmers. It ensures everyone—from front-end engineers to stakeholders—understands the architecture.
In Business Operations
It can clarify business workflows such as sales pipelines, customer onboarding, and marketing automation. For example, a marketing team might use a chart to design an email drip campaign, ensuring every customer interaction is consistent.
In Education
Teachers and students use this particular chart to understand complex topics like computer logic, biological cycles, or historical timelines. It’s a learning tool that makes abstract concepts easier to digest.
In Engineering and Manufacturing
Engineers create Flowcharts to design assembly lines, control systems, and maintenance protocols. These diagrams make operations efficient and error-free.
In Artificial Intelligence
AI systems, particularly those involving decision trees, rely on Flowchart-like structures to determine outcomes. They help visualize the flow of logic behind predictive models.
Resources
- Tetra: “The Ultimate Guide to Flowcharts”
- IBM: “Flowcharts and Algorithms in Software Development”
- SmartDraw: “Types of Flowcharts”
- Microsoft: “Visio Flowchart Templates for Process Visualization”
- TechTarget: “Definition and Importance of Flowcharts”