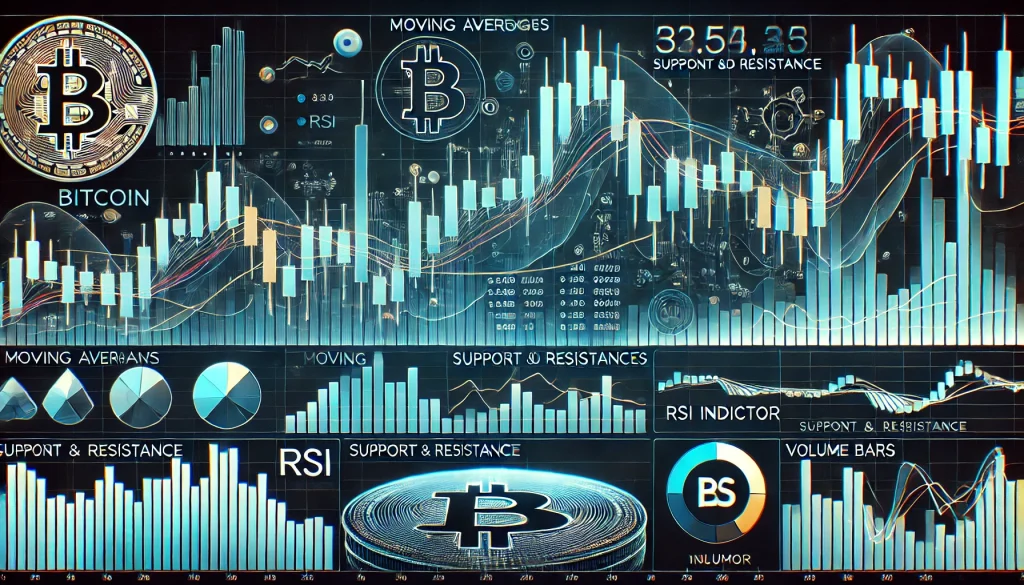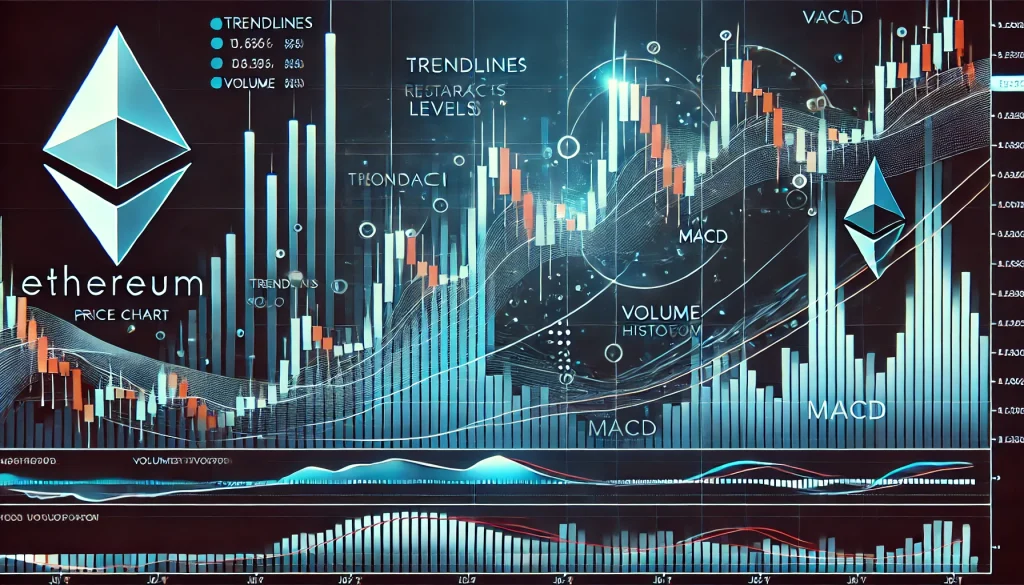
Analyzing cryptocurrency charts is an essential skill for anyone involved in the crypto arena. Whether you’re a trader, investor, or simply a crypto enthusiast, understanding these charts is crucial for navigating the volatile market. It helps you spot trends, recognize patterns, and make informed decisions to maximize your returns. Without a solid grasp of crypto chart analysis, you might miss out on opportunities or even make costly mistakes. This step-by-step guide will walk you through the basics of crypto chart analysis and show you how to utilize market trends and patterns for successful trading and investment strategies.
Materials or Tools Needed
Before you dive into crypto chart analysis, it’s important to be equipped with the right tools and knowledge. Here’s what you need to get started:
- Cryptocurrency Exchange Platforms: Access to platforms like Binance, Coinbase, or Crypto.com, where you can view live charts.
- Charting Tools: Use charting tools like TradingView to analyze crypto patterns effectively.
- Understanding of Key Metrics: Familiarize yourself with common crypto metrics, such as trading volume, moving averages, and support/resistance levels.
Step-by-Step Instructions

Step 1: Familiarize Yourself with Candlestick Charts
Candlestick charts are one of the most widely used tools in the crypto market. They provide a visual representation of price movements over specific periods. Each candle represents an opening, closing, high, and low price for a set time frame, such as one hour or one day. Green candles signify upward movement (bullish), while red candles indicate downward movement (bearish). By understanding candlestick charts, you can better predict market trends and make timely trading decisions.
Step 2: Identify Support and Resistance Levels
Support and resistance levels are critical in determining potential entry and exit points in the market. Support refers to the price level at which demand is strong enough to prevent the price from declining further, while resistance is where selling pressure prevents the price from increasing. Use tools like horizontal lines on a chart to mark these levels and watch how the price behaves when it approaches them. Breakouts above resistance or below support often signal potential big moves.
Step 3: Analyze Market Patterns
There are several patterns you need to know when analyzing crypto charts, such as Head and Shoulders, Double Tops/Bottoms, and Triangles. These patterns signal potential reversals or continuations in the market. For instance, a Head and Shoulders pattern often indicates a reversal from a bullish to a bearish trend. Spotting these patterns early can give you an edge in timing your trades.
Step 4: Use Moving Averages to Track Trends
Moving averages (MAs) help smooth out price action to identify trends over time. The Simple Moving Average (SMA) and the Exponential Moving Average (EMA) are two popular types. The SMA takes the average of a security’s price over a certain number of periods, while the EMA gives more weight to recent prices. When a short-term moving average crosses above a long-term one, it often signals a bullish trend, and vice versa for bearish trends.
Step 5: Pay Attention to Volume
Volume is the total number of crypto assets traded over a specific period. High volume during price movements suggests strong interest and increases the likelihood that the trend will continue. Conversely, low volume during a trend may signal that the trend is weakening. Always look for volume spikes to confirm trends or reversals in the market.
Step 6: Utilize RSI and MACD Indicators
The Relative Strength Index (RSI) and Moving Average Convergence Divergence (MACD) are popular technical indicators for crypto traders. RSI measures the speed and change of price movements, helping you identify overbought or oversold conditions. A value above 70 typically indicates overbought conditions, while a value below 30 suggests oversold. MACD, on the other hand, tracks the relationship between two moving averages and can help predict future momentum.
Do’s and Don’ts

Do’s:
- Do utilize multiple timeframes: When analyzing charts, it’s beneficial to check different timeframes (e.g., daily, hourly) to get a clearer picture of the market’s overall trend.
- Do set stop-loss orders: Protect yourself from market volatility by setting stop-loss orders, which automatically sell your position if the price drops to a certain level.
- Do combine technical analysis with market news: Crypto markets are influenced by more than just charts. External events like regulations, partnerships, or security breaches can have a massive impact. Keep an eye on news to complement your technical analysis.
Don’ts:
- Don’t trade based on emotion: Fear and greed are two powerful emotions that can cloud your judgment. Stick to your analysis and predefined strategies.
- Don’t ignore risk management: Proper risk management is crucial. Never invest more than you are willing to lose, and diversify your portfolio to mitigate risk.
- Don’t rely on one indicator: No single indicator will give you all the answers. Combine various tools like RSI, MACD, and volume to make more informed decisions.
Conclusion
Crypto chart analysis is an essential skill for anyone looking to succeed in the cryptocurrency market. By mastering candlestick charts, recognizing market patterns, and using key indicators like RSI and MACD, you can make smarter trading decisions. Remember to remain disciplined, practice patience, and never trade based on emotion. Armed with this knowledge, you’re now ready to navigate the crypto market with greater confidence.
FAQ
What is the best chart type for crypto analysis?
Candlestick charts are the most widely used for crypto analysis as they provide a detailed view of price movements.
How do I spot a trend reversal in crypto charts?
Trend reversals can often be spotted using patterns like Head and Shoulders or indicators like RSI and MACD, which signal overbought or oversold conditions.
Why is volume important in crypto chart analysis?
Volume indicates the strength of a price move. High volume during a trend suggests that the trend will likely continue, while low volume may signal a weakening trend.
Resources
- Changelly Blog. Complete Guide to Cryptocurrency Analysis.
- CoinRank Blog. How to Read Crypto Charts.
- CoinTelegraph Blog. Crypto Charts 101: How to Read Cryptocurrency Charts.
- Crypto.com Blog. How to Read Crypto Charts.
- Finder Blog. Technical Analysis for Crypto Markets.
